
The Growth Chart Mistake Almost Every Parent Makes Without Knowing
Are You Reading Your Baby's Growth Chart Wrong?

The WHO’s Multicentre Growth Reference Study followed 8,440 breastfed babies across 6 countries to build the chart most U.S. doctors now use for children under two. [1] This guide shows you exactly which chart applies to your baby, and the one percentile myth that sends parents into needless panic.
The nurse plots a dot. She looks at it half a second longer than feels comfortable. She doesn’t say anything.
Your stomach drops before she’s even opened her mouth.
I’ve been that parent. Heart already racing, already rehearsing questions, already convinced I’d missed something. Here’s what nobody told me at the time: that single dot might have been plotted on the wrong chart entirely.
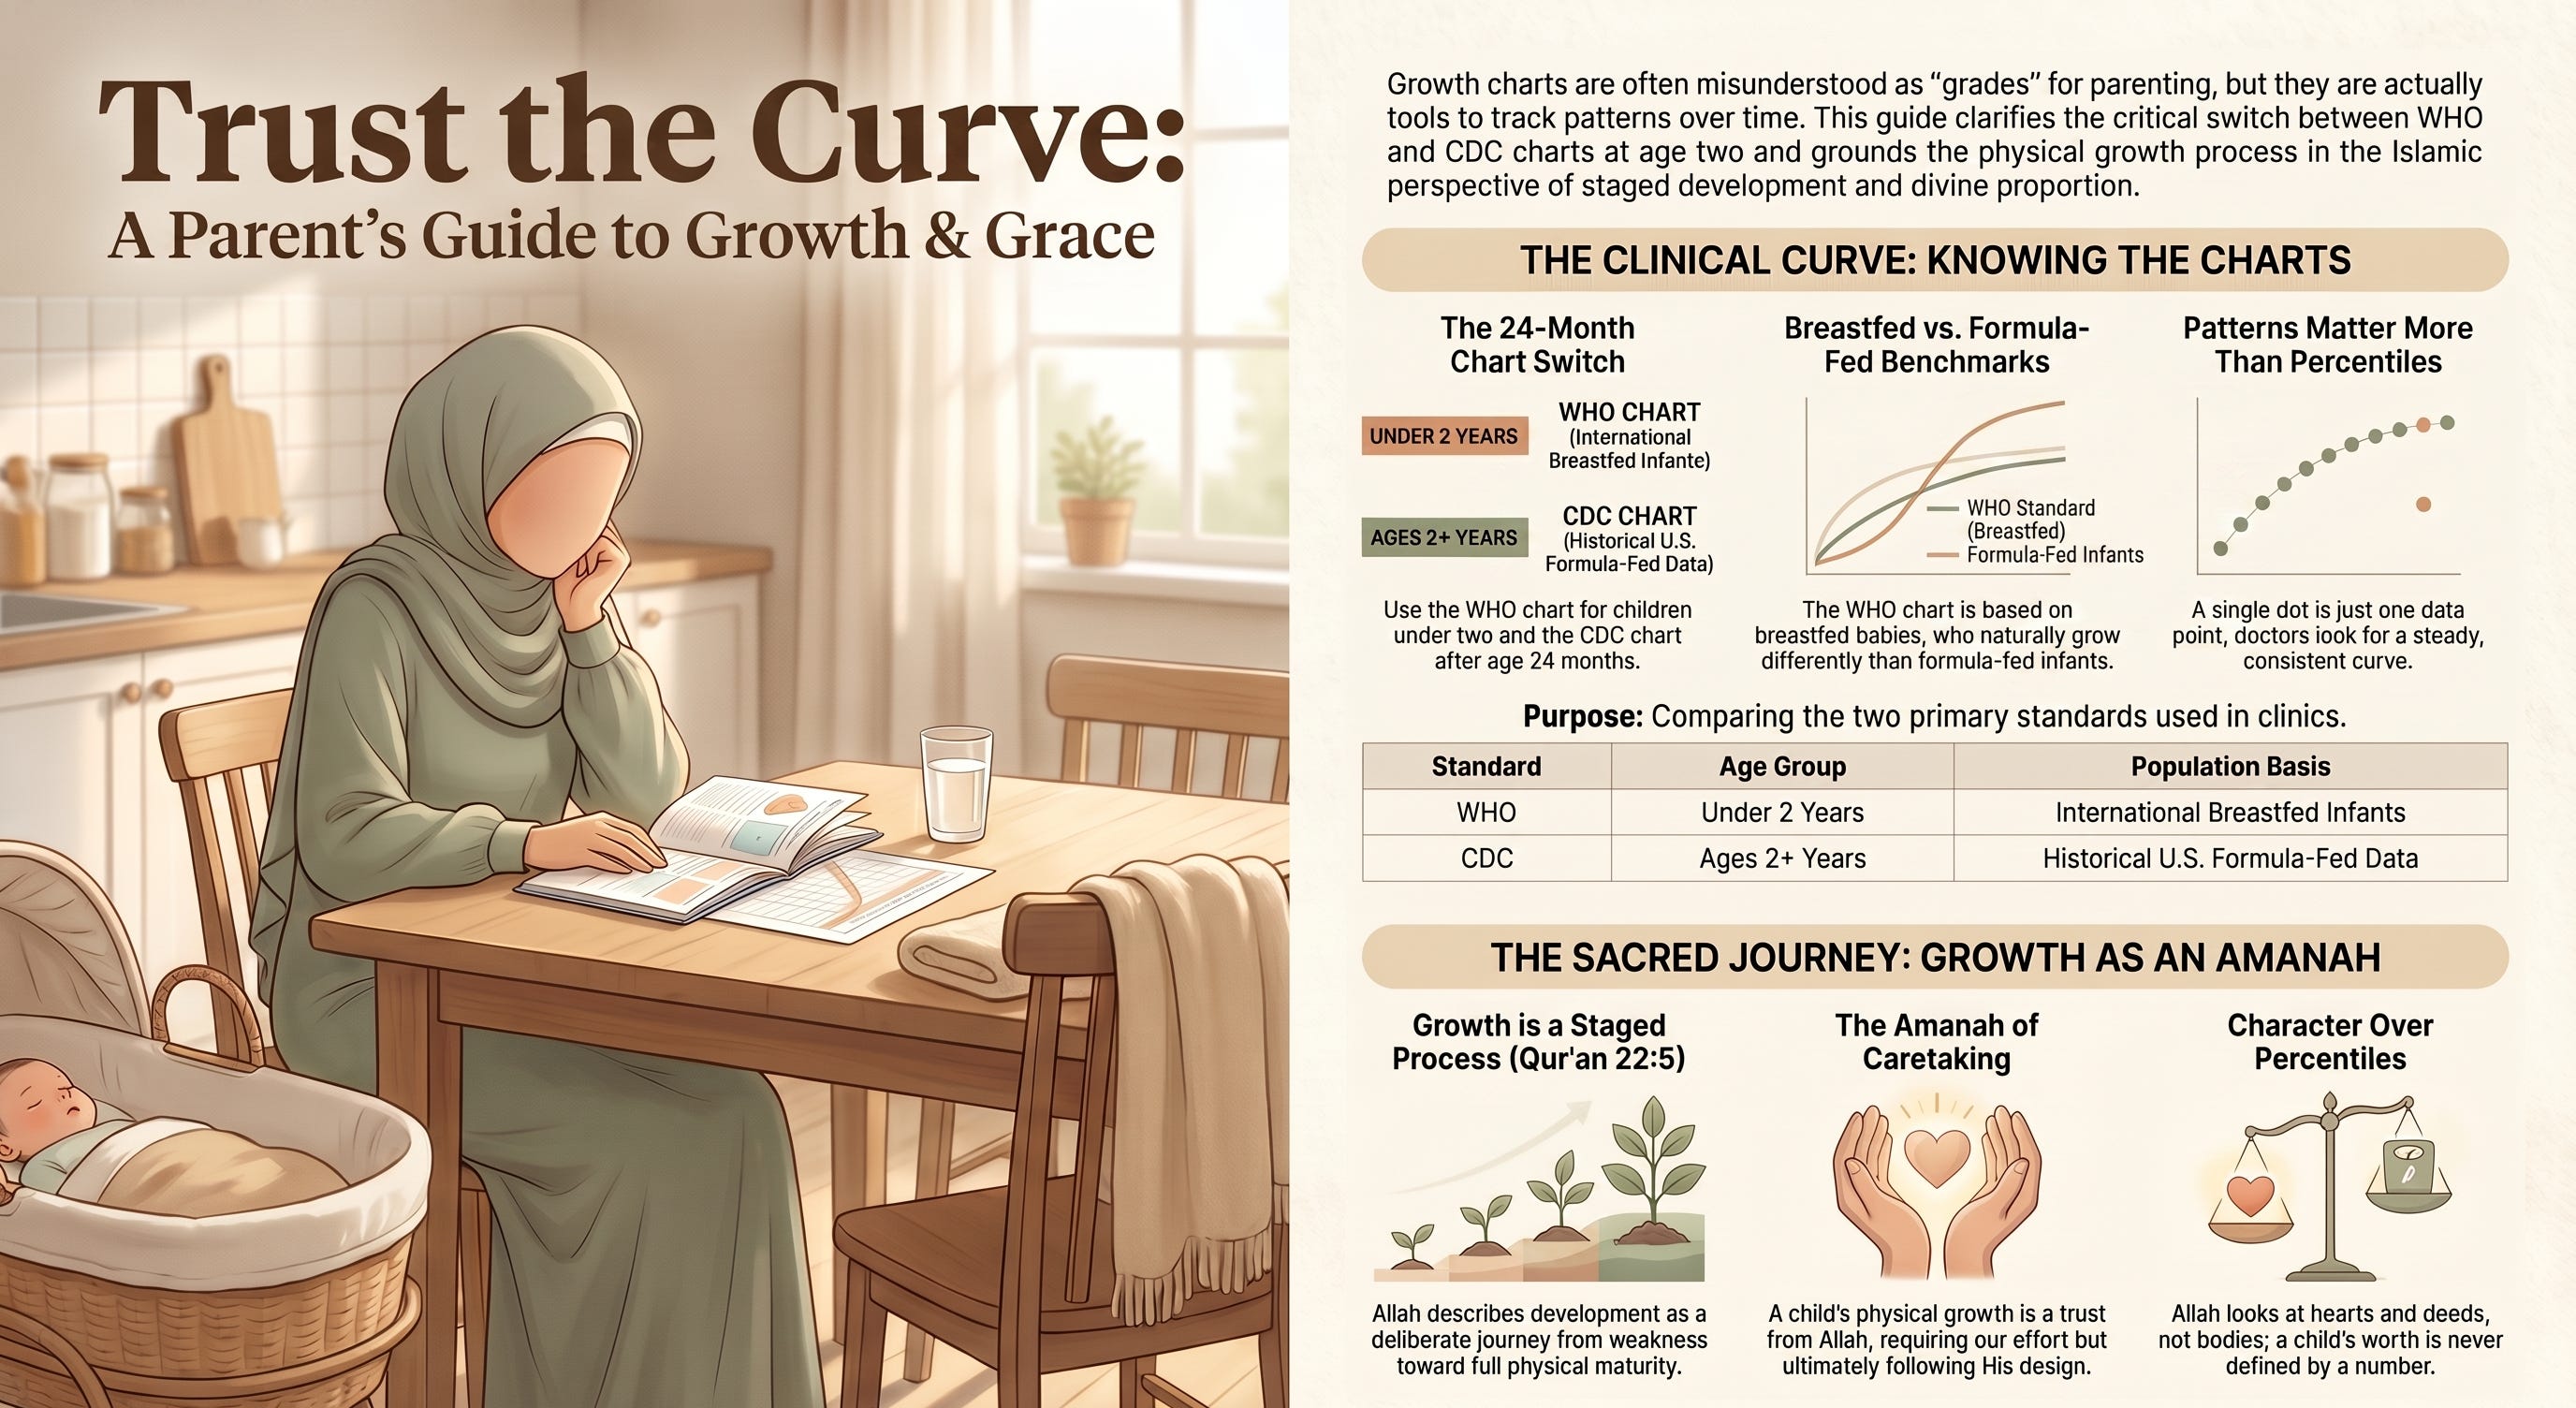
There are two growth charts. Most parents have never heard this. The WHO standard applies to children under two; the CDC reference takes over after that, and the switch happens at exactly 24 months. [2] A baby weighing 9 kilograms at one year can land at a completely different percentile depending on which chart the clinic happens to use that day.
Why This Guide Is Different
Built on the actual research, not just the pamphlet. This isn’t a repeat of what’s printed in your child’s health booklet — it includes the WHO/CDC chart distinction most parenting articles skip entirely, sourced from peer-reviewed methodology papers through 2024.
The Islamic framework isn’t bolted on. Qur’an 22:5 describes the exact stages a growth chart tries to measure, and a hadith most parents have never connected to parenting reframes what a percentile can and can’t tell you about your child.
You’ll walk away with the Trust the Curve Companion Pack — a printable reference card built to go in your bag for the next well-child visit, not just another PDF to forget.
What’s Actually on That Chart
A growth chart plots length or height, weight, and head circumference against age, using curves built from thousands of other children. [3] Doctors use it at checkups to confirm a child is developing well, and to flag anything that needs a closer look.
Here’s the part that surprised me most. The WHO chart — the one used for children under two in most clinics now — was built entirely from breastfed infants. [1][4] The CDC chart, used from age two onward, came from a mostly formula-fed U.S. population measured decades before the current childhood obesity era even began. [3][5] Same baby. Different chart. Sometimes a noticeably different number.
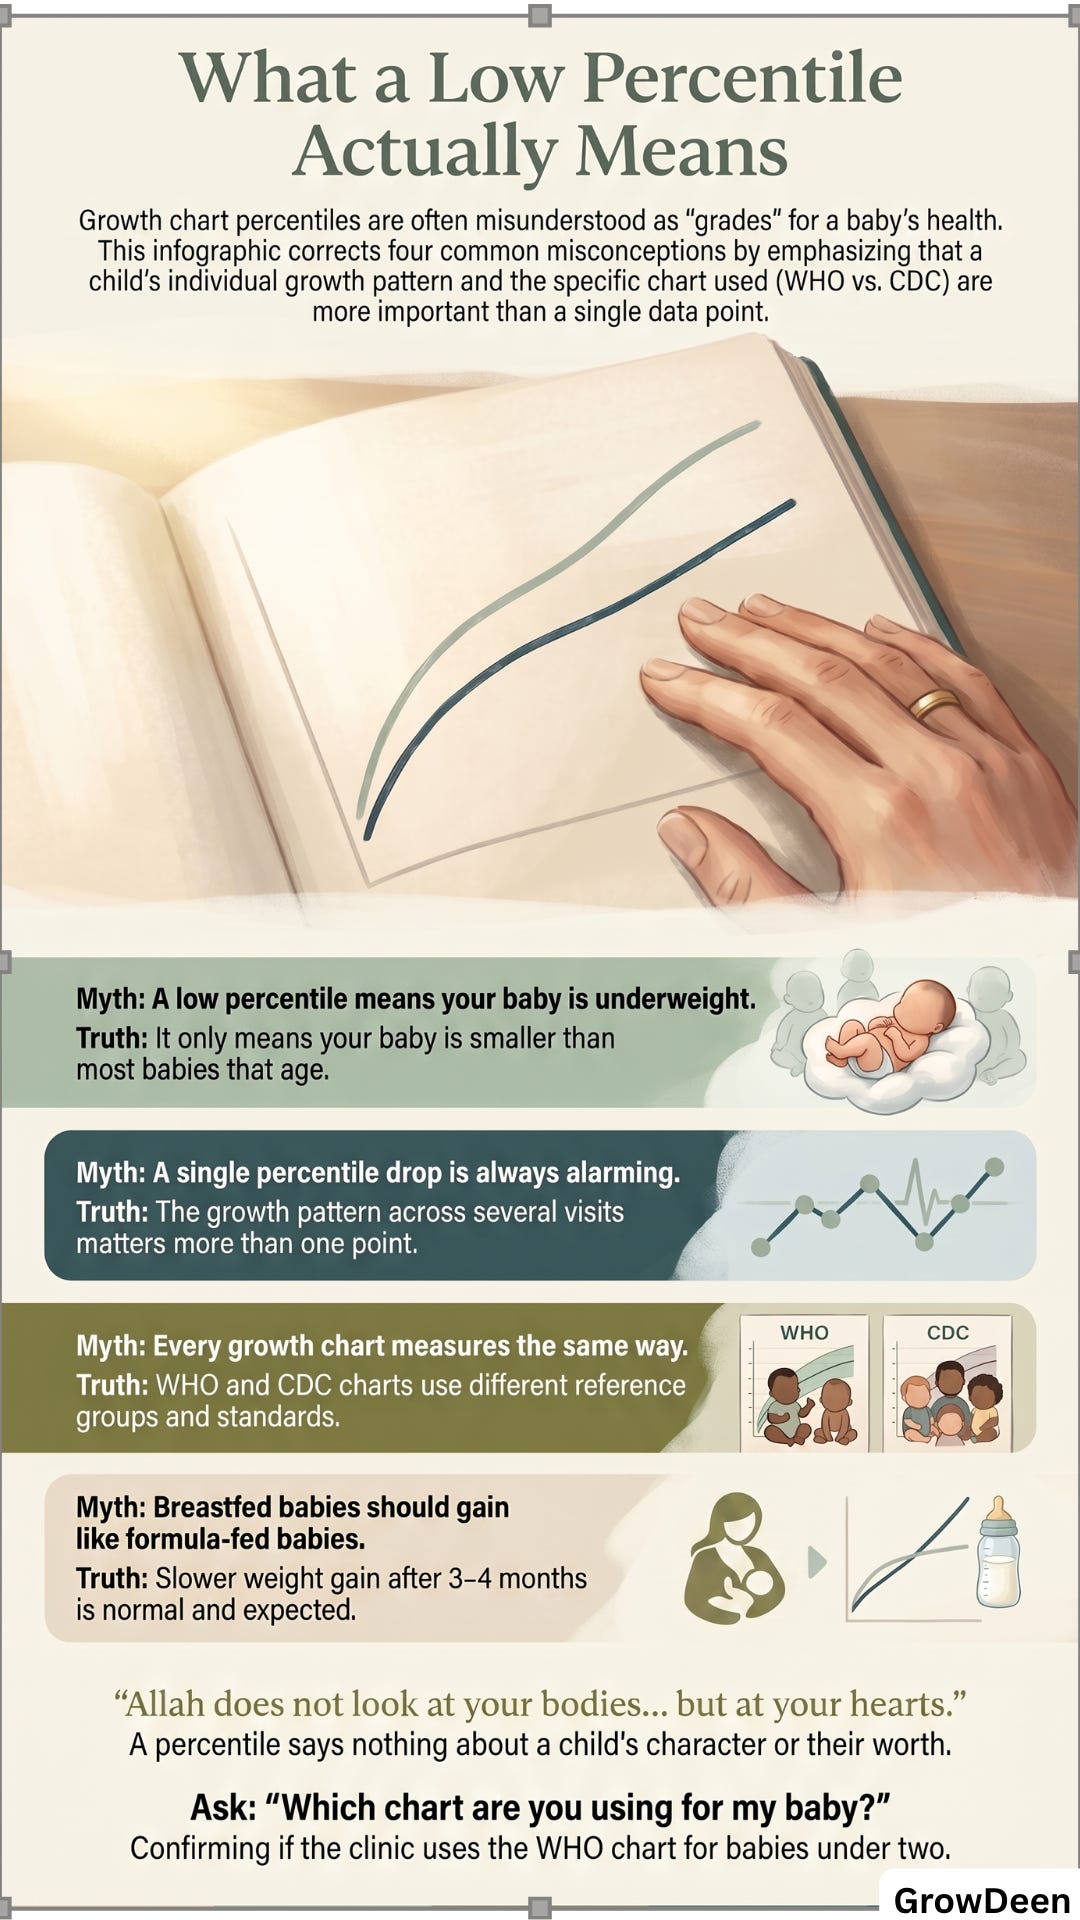
A breastfed baby naturally gains weight more slowly after three or four months than a formula-fed baby does. [3] That’s not a red flag. That’s biology. But plot that same baby on the wrong chart, and a doctor unfamiliar with the distinction might use the word “underweight” when nothing is actually wrong.
When was the last time anyone asked which chart your clinic uses?
What the Percentile Number Actually Means
A baby in the 10th percentile weighs less than 90% of babies that age. A baby in the 75th percentile weighs more than 75% of them. Neither is a problem. Both are simply describing where a child sits in a crowd — not whether anything is wrong. [6][7]
Picture this: a percentile drops between two visits, and a parent is suddenly convinced they’ve done something wrong. It’s one of the most common false alarms in well-child care, and almost never deserved. One number on one day tells a doctor far less than the pattern across several visits does. [7][8] One low point isn’t a verdict. It’s one data point on a much longer story.
Here’s what changed how I think about this entirely. The Prophet ﷺ said: “Indeed, Allah does not look at your bodies or your wealth, but He looks at your hearts and your deeds” (Sahih Muslim 2564). [11] A percentile number says nothing about a child’s character. Nothing about how deeply they’re loved. Nothing about who they’ll grow into. A baby on the 5th percentile and a baby on the 95th are equal in Allah’s sight — equally capable of becoming people of strong character.
I know this is a lot to remember, especially when you’re juggling a squirming toddler and a clipboard at the same time. That’s why I created the free Trust the Curve Companion Pack — a printable reference card you can keep in your bag. Keep reading to download it at the end of this article.
The Sacred Trust of Watching a Child Grow
As Muslim parents, every part of caring for a child’s body is part of our amanah — a trust Allah placed in our hands, not something we own outright. When I read the verse where Allah describes this very journey — “Then We bring you forth as a child, then [We develop you] that you reach your full strength” [Qur’an 22:5] [10] — I’m struck by how precisely it maps onto what a growth chart is actually trying to show. According to Tafsir Ibn Kathir, this verse describes the newborn as weak in body, hearing, sight, and movement, with every one of these faculties strengthening by degrees until the child reaches ashudd, full physical maturity. The growth Allah describes here isn’t instant. It’s staged. Deliberate.
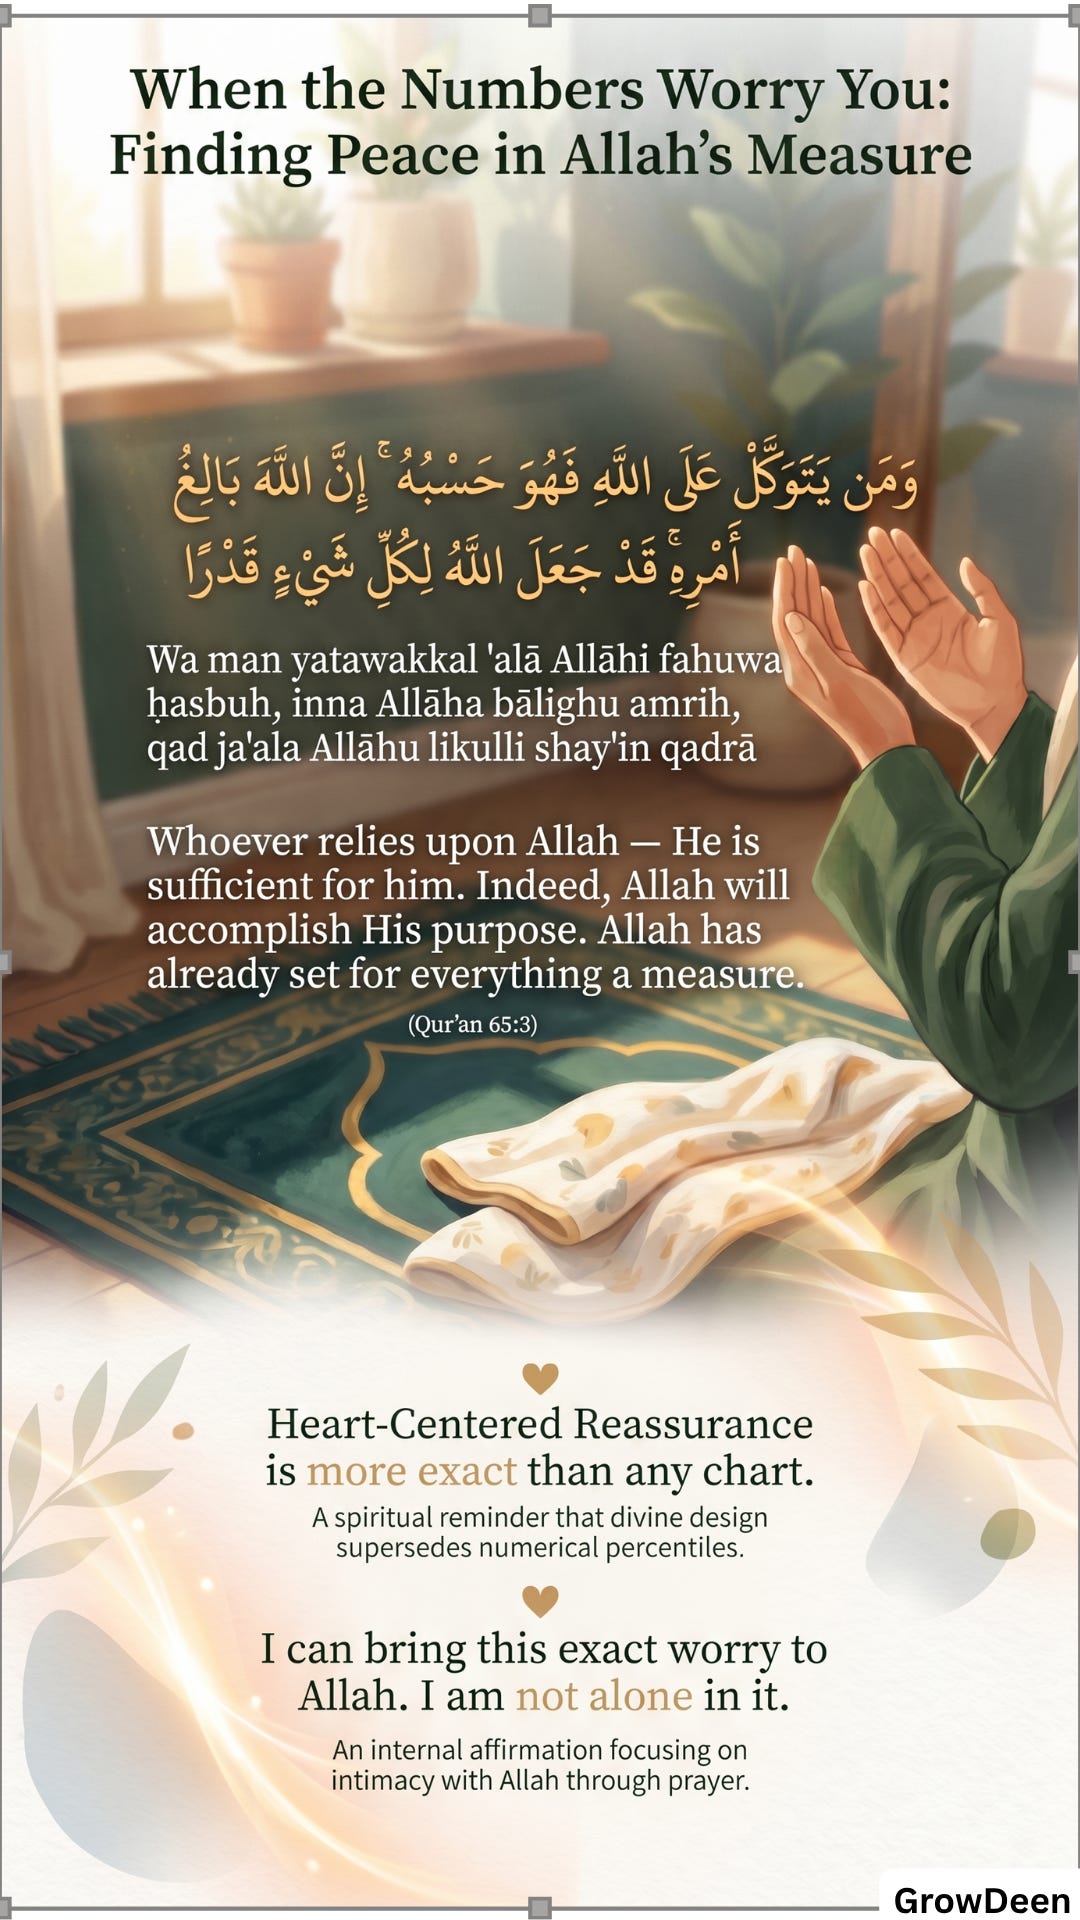
That’s the lens I bring to every checkup now. Take the means — show up, ask questions, feed your child well. Then release the rest. The hadith on Allah weighing hearts, not bodies [11], gives me real relief whenever I catch myself comparing my child’s numbers to someone else’s child’s. What the research confirms about growth being individual and pattern-based, and what the Qur’an teaches about Allah designing this process stage by stage, are pointing at the same truth from two directions.
When to Actually Call the Doctor
Speak with a doctor promptly if a curve shifts suddenly, drops significantly between visits, or shows up alongside poor feeding, low energy, or visible distress. None of this replaces an actual medical assessment. Always follow your own doctor’s guidance for your specific child.
Inside the Trust the Curve Companion Pack (one comprehensive PDF, 3 pages):
Page 1: Which Chart Applies to My Child? Quick-Reference Card — A clear visual showing the WHO-to-CDC switch point, what percentiles actually mean, and the one question to ask your doctor — designed as a card you can keep in your diaper bag or stick on the fridge.
Page 2: The “Is This Actually a Problem?” Decision Guide — A simple checklist separating normal variation from genuine reasons to call the doctor, pulled directly from this article’s medical guidance, so you can walk into any appointment already knowing what matters.
Page 3: “In Whatever Form He Willed” — An Islamic Reflection Card — A short, beautifully designed card built around Qur’an 82:6–8, where Allah describes shaping every person in the exact form He willed, paired with a brief reflection for parents on releasing comparison between children.
This isn’t just a PDF to download and forget. It’s a tool designed to stay in your bag — where you’ll actually reach for it the next time a nurse plots a dot and goes quiet.
This Trust the Curve Companion Pack is what every subscriber receives with each article. We cover the full journey of raising Muslim children, all backed by scientific research and rooted in Islamic wisdom.
If you’re a Muslim parent who wants both evidence-based guidance and Islamic perspective, subscribe for free so future resources arrive in your inbox before you need them.
Subscribe free for parenting resources backed by both science and Sunnah — guidance so unique, you literally can’t get it anywhere else. No spam, no clutter, just resources that matter.
Before your next well-child visit, do this: write down one question — “which growth chart are you using for my baby?” — and actually ask it out loud. That’s it. That’s today’s action.
May Allah place barakah in your effort, accept your intention, and make the care you give more protective, more merciful, and more rewarded than it feels in the moment.
Share This With Someone Who Needs It
Think of one person right now: the friend who texted you a photo of her baby’s growth chart last week, asking “is this normal?” with three worried emojis. The sister at the masjid who mentioned her pediatrician used a word like “underweight” and she’s been quietly panicking since.
This article could give them the exact relief you just felt. Share it with them today — not as advice-giving, but as support. Sometimes the most loving thing we can do is pass along what finally made sense to us.
Frequently Asked Questions
Q: What’s the actual difference between WHO and CDC growth charts?
A: The WHO chart is built entirely from breastfed infants across 6 countries and is used for children under two. [1][4] The CDC chart, used from age two onward, comes from an older, mostly formula-fed U.S. population. [3] Using the wrong one for your child’s age can shift the percentile shown.
Q: Is it normal for my baby’s percentile to change between visits?
A: Yes, small shifts are common and usually meaningless. [7] It’s the pattern across several visits — not one single number — that tells a doctor something useful. See “What the Percentile Number Actually Means” above for the full explanation.
Q: Should I worry if my baby is in a low percentile, like the 5th or 10th?
A: Not on its own. A baby in the 5th percentile weighs less than 95% of babies that age, but is still completely within the healthy range. [6] Worry less about the number, more about whether the curve is climbing steadily over time.
Q: Do breastfed babies grow differently than formula-fed babies?
A: Yes. Breastfed babies typically gain weight more slowly after three to four months than formula-fed babies do. [3] This is expected, healthy, and exactly why the WHO chart — built from breastfed infants — exists.
Q: How often should my baby actually be weighed and measured?
A: Most well-child schedules measure babies at every checkup in the first two years — roughly monthly at first, then less often. Ask your doctor for your child’s specific schedule, since it can vary slightly by clinic.
Q: What does a growth chart percentile actually measure?
A: It shows where your child’s measurement sits compared to other children the same age — not a grade, not a ranking, just a position in a range. [6][7] A child on any percentile from roughly 3rd to 97th is generally considered within typical variation.
References
[1] de Onis, M., Garza, C., Victora, C.G., Onyango, A.W., Frongillo, E.A., & Martines, J. (2004). The WHO Multicentre Growth Reference Study (MGRS): Planning, study design, and methodology. Food and Nutrition Bulletin, 25(1 Suppl 1), S15–S26.
[2] Centers for Disease Control and Prevention (CDC). (2010). Use of World Health Organization and CDC growth charts for children aged 0–59 months in the United States. MMWR Recommendations and Reports, 59(RR-9), 1–15.
[3] de Onis, M., Garza, C., Victora, C.G., Onyango, A.W., Frongillo, E.A., & Martines, J. (2007). Comparison of the World Health Organization (WHO) Child Growth Standards and the CDC 2000 growth charts. Journal of Nutrition, 137(1), 144–148. https://doi.org/10.1093/jn/137.1.144
[4] World Health Organization (WHO). (2025). The WHO child growth standards. WHO.
[5] Centers for Disease Control and Prevention (CDC). (2024). CDC growth charts. CDC.
[6] Ziegler, E.E., & Nelson, S.E. (2012). The WHO growth standards: Strengths and limitations. Current Opinion in Clinical Nutrition and Metabolic Care, 15(3), 298–302. https://doi.org/10.1097/MCO.0b013e3283511478
[7] Ramsden, L., & Day, A.S. (2012). Paediatric growth charts: How do we use them and can we use them better? Journal of Paediatrics and Child Health, 48(1), 22–25. https://doi.org/10.1111/j.1440-1754.2011.02185.x
[8] Humphrey, G., Dobson, R., Parag, V., Hiemstra, M., Howie, S., Marsh, S., Morton, S., Mordaunt, D., Wadham, A., & Bullen, C. (2021). See how they grow: Testing the feasibility of a mobile app to support parents’ understanding of child growth charts. PLoS One, 16(2), e0246045. https://doi.org/10.1371/journal.pone.0246045
[9] Sandler, A. (2021). The legacy of a standard of normality in child nutrition research. SSM – Population Health, 15, 100865. https://doi.org/10.1016/j.ssmph.2021.100865
[10] Qur’an, Surah Al-Hajj 22:5 — https://quran.com/22/5, with Tafsir Ibn Kathir on the stages of human development from infancy to full maturity (ashudd) — https://quran.com/en/22:5/tafsirs/en-tafisr-ibn-kathir
[11] Sahih Muslim 2564 — Graded: Sahih — https://sunnah.com/muslim:2564
[12] Qur’an, Surah Al-Infitar 82:6–8 — https://quran.com/82/6, with Tafsir Ibn Kathir confirming Allah created and proportioned every person in the particular form He willed — https://quran.com/en/82:7/tafsirs/en-tafisr-ibn-kathir